Monday, March 20, 2017

A look at some STI stocks

Asian Pay TV Trust

APTT formed a bottom at 0.38, the MAs are still pointing to a bearish consolidation, Price has broken the longer term trendline and is currently retesting at 0.42, the same price is support (Support + 61.8 retracement+ trendline retest) indicates that price now is very important , If price extends in a recovery, it targets 0.56 - 0.58, which is former support turned resistance and the 38.2 retracement from 04/06/2015.

Fundamentally, taiwan has a lot of online TV channels with a growing following. If APTT can leverage on this, then growth will be sustainable.
Expect 0.56-0.58 to be strong resistance, and consolidation may take a further one year. between 0.58 - 0.50 range.

Great Eastern

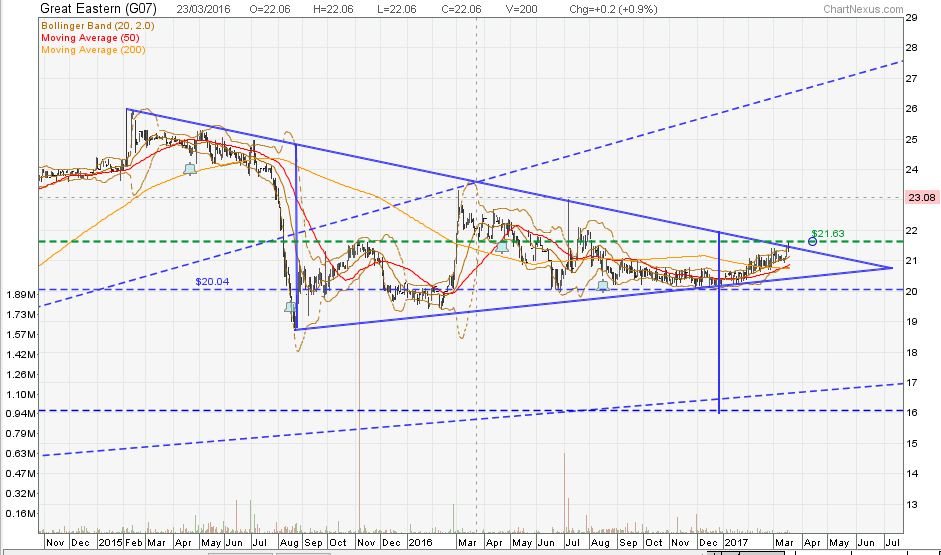
Great Eastern is reaching the apex of the triangle, price is now hitting resistance and a close above 21.63 will target 26.5++ region. Below $20, targets $16.
There is a golden cross forming with the 50 MA above the 200 MA, showing that price is leaning towards bullish.

Lippo Malls Trust

Lippo Malls looks like it could be forming a double top, with price hitting resistance 0.4, neckline is 0.36.

Mewah

Mewah could be retesting a broken trendline at $0.32. Above 0.36, price will be positive.


Friday, March 17, 2017

A look at the STI and some stocks

Dear all,

I haven't have much time to do this and monitor the markets.
Just had some time to look at some stocks and thought that I should put this up.
Lets take a look.

Capital R China Tr


This stock has been in a triangle since 24/08/2015, the recent move from $1.34 on an inverted h&s pattern has completed its run to hit the 200EMA and retreated to form a h&s again targeting 1.34, it is possible that a bat formation is in the works to end $1.36-1.34, where it coincide with the lower end of the large triangle. A possible flag formation from 01/09/2016 has been invalidated IMHO. So a triangle is more likely.

Possible entry price stated above.


QAF

QAF is on a uptrend channel, the poke above the channel top is a bit of a concern, as a break below the channel bottom will lead to a larger decline. Price has hit the 38.2 retracement and retreated, if price exceeds the higher, it is possible for it to be a flag formation targeting higher. However, if price rejects at the broken trendline drawn above, then $1.2 will be the target at the channel bottom.

Aims Amp Cap Reit

This chart is so messy, my closest guess is that it is in a triangle, its peak is almost reached, support is at $1.34.

Delfi

Delfi has moved out of the downtrend line, price has been around this region since 08/01/2016. Probably a good place to put in a small position.

SATS

SATS has moved off the high, for now it is still in a uptrend channel, Price is nearing the support at $4.76-4.74.


This blog is not a buy, sell or hold recommendation.


Saturday, February 4, 2017

A look at STI and some stocks

I'm sorry to say that even though I made a resolution to do more blogging to keep track of certain stocks of interest I really haven't had much time to do so.
Even now, I am doing this instead of other stuff that I'm supposed to do, because this is easier than that.

So on to it.


The STI ETF has hit overhead resistance at $3.1 and retreated, expected support is at $2.9. With Donald Trump on the helm of the US, I really do not know what to expect. However, British stocks will be on my mind... I'll think of how to have exposure to that. Perhaps a GBPUSD trade will do.


Diary Farm has reached an important resistance, I will look for pull backs to add if interested. Otherwise, I will add to other stocks.


SATS is a stock that I have been looking at. It doesn't seem to want to fall down to a price that is a bargain....
any run to $4.6 is good now.


Value Max is in a triangle formation for sometime. If you believe in the pawnbroking business, $0.24, seems good.
The other is MoneyMax and Maxicash


Both are trading near the top of the range, so a pull back will be a good place to buy if interested.