DXY is still in a range 96.60 - 95.60.
Price is at the support now, though I still like it at the neckline of the double bottom for a long.
If price breaks resistance, I expect a test of 97.00 then 99.00 on a flag extension.
Take note that it is near the end of the month of June.
I have no positions currently.
Tuesday, June 28, 2016
Monday, June 27, 2016
eurusd and dxy
A look at the eurusd and DXY.
The eurusd is in a longer term channel. support 1.0915, resistance 1.110 to 1.1170. looks like a sell on rallies.
I am keeping away from the gbp, as it is very volatile.
The DXY looks like the usdchf, support is at 95.90 and resistance at 97.70 - 98.00, which coincide with fib extension to 1.618.
The eurusd is in a longer term channel. support 1.0915, resistance 1.110 to 1.1170. looks like a sell on rallies.
I am keeping away from the gbp, as it is very volatile.
Saturday, June 25, 2016
sgdmyr
SGDMYR, with the brexit and the turmoil all over, we can see the sgdmyr going to much higher places if 3.1 is broken. there is a long standing channel from 1991 on the monthly that could form a top at the completion of the flag.
Fibonacci retracement shows a 38.2% retrace, which is very shallow.
On the 4 hr , any price towards 3.014- 3.000 is good to buy. Could get the price on the early start of the week.
I have no position in the sgdmyr and may establish some next week. targets 3.1 - 3.3.
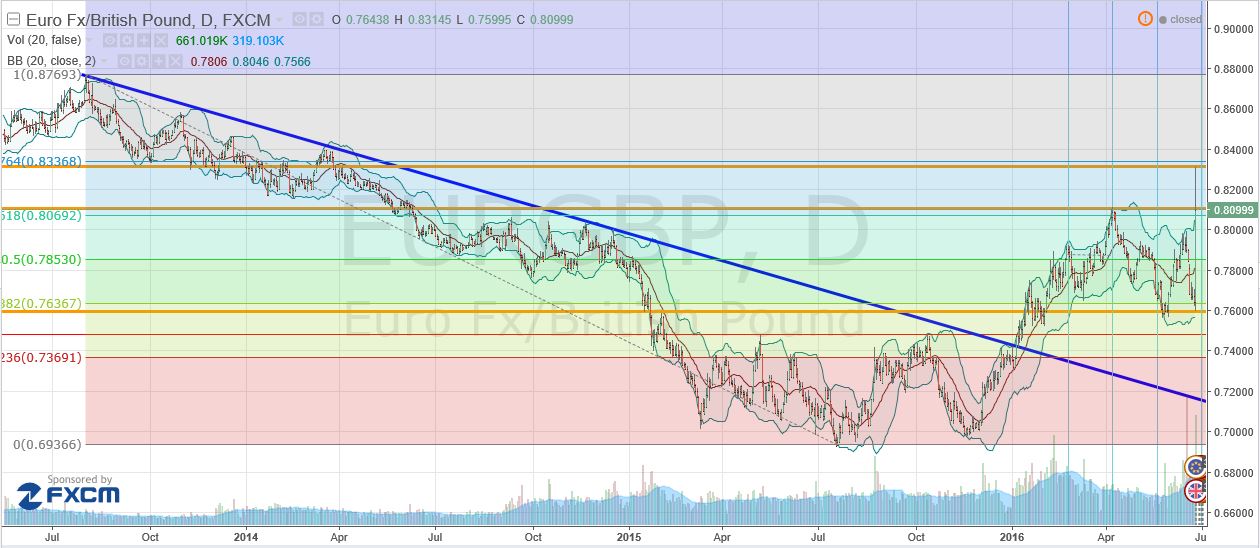
eurgbp
With the EU referendum and leave vote from Brexit, GBP crashed the floor. So this week, I took leave from the markets and stayed away from this high risk event.
From the daily chart,
We can see why the EURGBP price moved from one point to another.
The close is at the resistance, so there is potential for the move within this range. Though I will look at other pairs to trade instead and observe for awhile more.
In many pairs there are many long wicks, so will have to observe price action next week to determine if there is momentum in the movement or its one off.
Monday, May 16, 2016
eurgbp
Eurgbp is building the right shoulder and should break down this week, otherwise risk is to the upside.
Friday, May 6, 2016
a look at some shares on the SGX
With market volaility so high, we must be careful to enter at the right price.
Based no technical analysis, I have looked at some shares and will need to look into their books for further identification if it is the right share for me to own.
Dairy farm, has been trading at a low price of 5.6-5.8 before a recent sharp breakout to reach the 50% retracement of the most recent down move and a 38.2% retracement of the down move from 10/01/2015. Now has entered the secondary area and pull back.
The highlighted prices are good areas I think to enter long.
Gives consistent dividend and if price goes to near $6.20-6.25 I will buy.
A pull back to $6.57-6.51 and a bounce will make the most recent move a flag pattern with a break of highs at $7.2 will lead to new highs and extension to $8-$8.3.
Great Eastern, Tested the under and crawling along it. $16 strong support. Has strong presence in Asia.
Super group, will need to study this more on the fundamentals, recent venture into China. Dont know how it is like. Price at $0.2 will be very attractive if we ge there.
Hyflux, missed buying it when it was $0.50 ish. Oh well.. $0.54 will be the completion of double top and $0.51 will be some strong support. Water is a precious resource. Still need to take a look at the books.
Subscribe to:
Posts (Atom)