Friday, March 16, 2018

BTCUSD and BCHUSD update

BTCUSD daily


BTCUSD looks to be heading towards 6899 - 7423 region, where there are some strong levels of support. Price region at support also coincide with a flag extension from 5 - 9 mar 18.
If BTC USD is on a technical retracement, price should be supported there this week.

BCHUSD daily


BCHUSD looks to be heading towards 733 to 847 region. Where there is some strong support. Price coincides with minor channel support and price levels.
Price has reached oversold. Should be supported there this week.

BTC/ BCH overlay

As observed BCH price is also affected by BTC. Interestingly, the price is at the same levels and are moving very close correlation.

Friday, March 9, 2018

A look at Bitcoin cash

Cryptocurrencies are all the rage with their wild swings and stories of billionaires who are made every time it makes new highs.

With current news, such as

Bitcoin price: Cryptocurrency DROPS below 9k after HARSH words from federal commission

cryptocurrencies have been dropping like rocks.

Is this a chance or is this the road to the end?

Here is a Technical analysis for long term chart.

Bitcoin


Bitcoin is forming a bullish hammer at the broken resistance TL, if closes above the TL is bullish.

Bitcoin cash


 Bitcoin cash the result of the hardfork split from Bitcoin may be in the process of forming a butterfly. The pattern is not confirmed yet, as there is no candles in the chart. However, if bitcoin rises, the rest of the cryptocurrencies may be dragged up.

Disclaimer: This is not a recommendation to buy sell or hold.

Monday, March 20, 2017

A look at some STI stocks

Asian Pay TV Trust

APTT formed a bottom at 0.38, the MAs are still pointing to a bearish consolidation, Price has broken the longer term trendline and is currently retesting at 0.42, the same price is support (Support + 61.8 retracement+ trendline retest) indicates that price now is very important , If price extends in a recovery, it targets 0.56 - 0.58, which is former support turned resistance and the 38.2 retracement from 04/06/2015.

Fundamentally, taiwan has a lot of online TV channels with a growing following. If APTT can leverage on this, then growth will be sustainable.
Expect 0.56-0.58 to be strong resistance, and consolidation may take a further one year. between 0.58 - 0.50 range.

Great Eastern

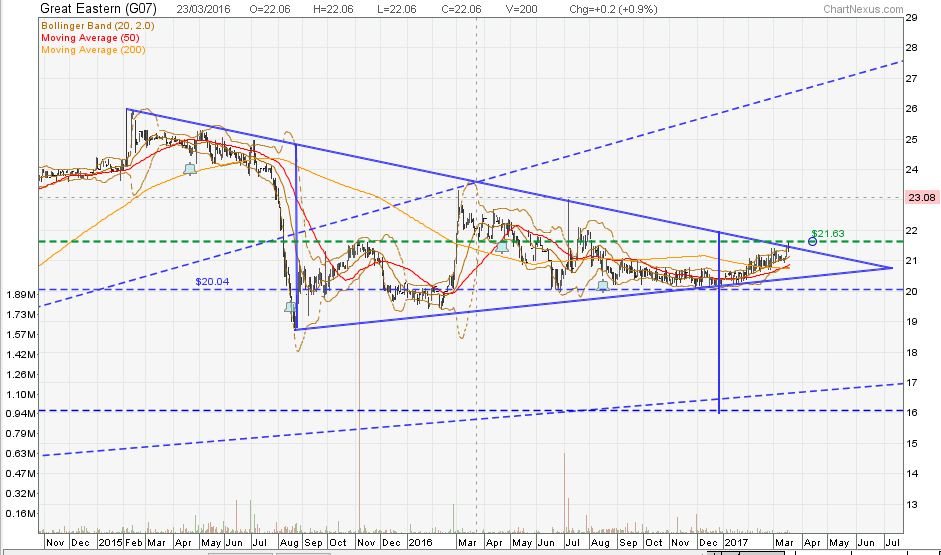
Great Eastern is reaching the apex of the triangle, price is now hitting resistance and a close above 21.63 will target 26.5++ region. Below $20, targets $16.
There is a golden cross forming with the 50 MA above the 200 MA, showing that price is leaning towards bullish.

Lippo Malls Trust

Lippo Malls looks like it could be forming a double top, with price hitting resistance 0.4, neckline is 0.36.

Mewah

Mewah could be retesting a broken trendline at $0.32. Above 0.36, price will be positive.


Friday, March 17, 2017

A look at the STI and some stocks

Dear all,

I haven't have much time to do this and monitor the markets.
Just had some time to look at some stocks and thought that I should put this up.
Lets take a look.

Capital R China Tr


This stock has been in a triangle since 24/08/2015, the recent move from $1.34 on an inverted h&s pattern has completed its run to hit the 200EMA and retreated to form a h&s again targeting 1.34, it is possible that a bat formation is in the works to end $1.36-1.34, where it coincide with the lower end of the large triangle. A possible flag formation from 01/09/2016 has been invalidated IMHO. So a triangle is more likely.

Possible entry price stated above.


QAF

QAF is on a uptrend channel, the poke above the channel top is a bit of a concern, as a break below the channel bottom will lead to a larger decline. Price has hit the 38.2 retracement and retreated, if price exceeds the higher, it is possible for it to be a flag formation targeting higher. However, if price rejects at the broken trendline drawn above, then $1.2 will be the target at the channel bottom.

Aims Amp Cap Reit

This chart is so messy, my closest guess is that it is in a triangle, its peak is almost reached, support is at $1.34.

Delfi

Delfi has moved out of the downtrend line, price has been around this region since 08/01/2016. Probably a good place to put in a small position.

SATS

SATS has moved off the high, for now it is still in a uptrend channel, Price is nearing the support at $4.76-4.74.


This blog is not a buy, sell or hold recommendation.


Saturday, February 4, 2017

A look at STI and some stocks

I'm sorry to say that even though I made a resolution to do more blogging to keep track of certain stocks of interest I really haven't had much time to do so.
Even now, I am doing this instead of other stuff that I'm supposed to do, because this is easier than that.

So on to it.


The STI ETF has hit overhead resistance at $3.1 and retreated, expected support is at $2.9. With Donald Trump on the helm of the US, I really do not know what to expect. However, British stocks will be on my mind... I'll think of how to have exposure to that. Perhaps a GBPUSD trade will do.


Diary Farm has reached an important resistance, I will look for pull backs to add if interested. Otherwise, I will add to other stocks.


SATS is a stock that I have been looking at. It doesn't seem to want to fall down to a price that is a bargain....
any run to $4.6 is good now.


Value Max is in a triangle formation for sometime. If you believe in the pawnbroking business, $0.24, seems good.
The other is MoneyMax and Maxicash


Both are trading near the top of the range, so a pull back will be a good place to buy if interested.

Friday, December 2, 2016

Stocks in SGX

Great Eastern
 
 
Hyflux

 
Japan Foods

 
Japfa


Maxi cash

 
Mewah Int

 
Money Max Fin

 
Olam Intl

 
QMDental

 
SATS

 
Value Max


Saturday, November 19, 2016

A look at SGX stocks

I have been very busy with Life, so havent been tracking the SGX stocks. But the stock market moves in a crawl anyway.

In a previous post in september, I blogged about SUPER and how it technically looks like it was breaking out. Well, we all know why now.

Anyway, if it succeeds that means that my plans for having some beverage company shares just went down the pipe. So now that I finally have got some time, I'm looking at some stocks that are on my radar in terms of price and technicals.

Dairy Farm
 
Dairy Farm is in channel resistance and may well go back to test $6.20, where a good buy will be.

HongLeong Asia


This is a new stock I'm interested in. Price has been in a consolidation for a long time and nearing the bottom of the range. The next move will be within a month if the TL is to be respected or broken.

Some facts about HL Asia.


Hong Leong Finance

 
Not to be confused with the above company, this share has been in a down channel. The inverted head and shoulders pattern is too long on the right shoulder and should be a continuation pattern. $2.01 is a good price to enter.

Lippo Malls

 
Lippo Malls Tr now on the support of a upward channel. May be a good price to entire considering the long wick at the bottom of the channel signalling strong buyer interest.


OCBC bank

 
Has broken out of the triangle and now at resistance. Price probably targets the yellow resistance
 
 
 OUE

OUE has broken out of the downward channel and at the resistance now. Targets $2.0.


QAF
 
This is one stock that splits its investor's faces into grins. Price has run higher than I initially thought. Nevertheless, I think $1.10 is still a good buy when it comes down. Be wary of buying in at current price, as shown on the chart.
 
 
SATS


SATS price is still hanging around. Support is $4.50.


 Singapura finance

 
This share is still hanging out at the bottom. So risk is a drop to 0.65 or even towards, 0.58.
 
 
Thai Beverage


If you think that beer is going to sell like me, you'll be interested in this stock. 0.81 will be ideal, but i might nibble here as it is near short term channel support.


Wingtai
 
Wingtai at $1.4 will be a good buy. This stock may be hit next year due to recession that may happen.