After the high on 2016-01-08, the USDSGD has been trending down and broken the rising channel.
A quick look at the fibonacci retracement from 2015-04-27 to 2016-01-11 high, we are at the 0.764 retracement.
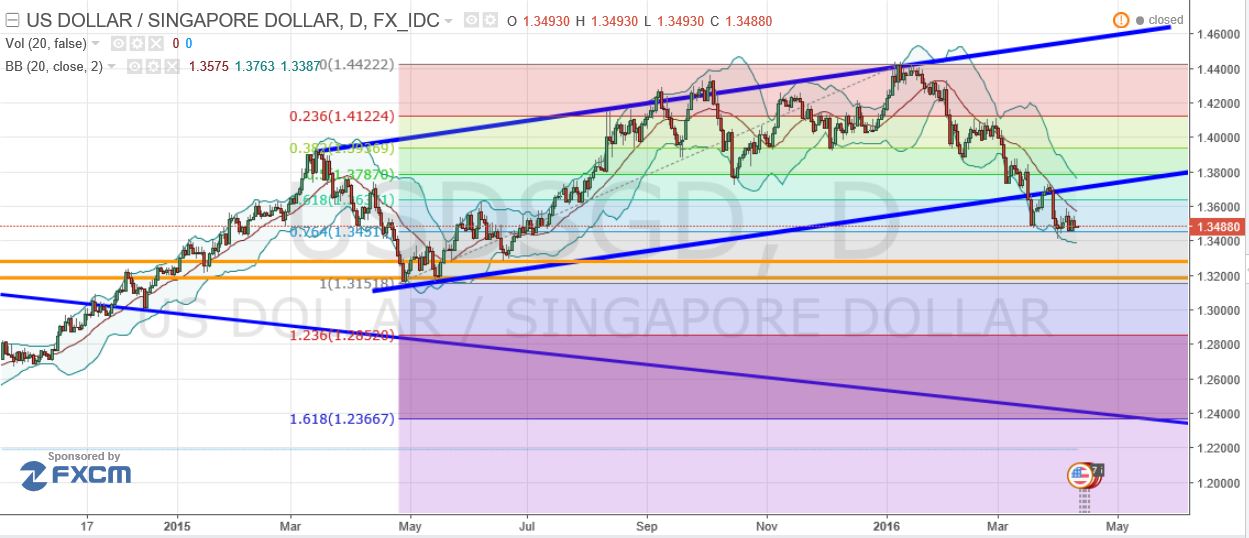
From the recent high at 2016-01-08 to 2016-02-11, we are at the 1.618 extension.
On the 4hr we have started to make higher lows,on the daily there is a pennant formation and on the monthly, we are making a very long wick doji after a big bearish candle.
If we are to go long here, risk is below 1.3400 for 1.3680. 90 pips risk for 190 pips. 1:2 risk:reward.
Looking at DXY

We are close to support at 92.70, which I think a test will coincide with a short break to below the support.
So I will look for lower at 1.3300 for USDSGD where there is very strong support for a long.
Interim support is here, and I am not yet convinced on the turn yet.
No comments:
Post a Comment