Showing posts with label usdjpy. Show all posts

Wednesday, July 27, 2016

usdjpy


USDJPY spiked today to test the resistance of the longer trendline again. Price remains under 106.50, a break of which will cause the USDJPY to break out and up.

Monday, July 25, 2016

usdjpy


USDJPY has dropped from the dailt trendline resistance and is heading towards the 38.2% retracement of the most recent upmove. 103.7 is the support and 50% retracement as well as a completion of the head and shoulders. resistance is back at 105.40-60. Interim support of a possible channel (smaller) is right here @ 104.40.


Sunday, April 17, 2016

YEN PAIRS

A look at the JPY pairs this week.

The weekly on the USDJPY has formed a big bearish candle that hardly even retested the 32.8% retracement from the most recent fall. However, if we place a fibonacci retracement on the nearby weekly candle, the 50% retracement has been retested.


The 61.8 retracement is 100.20 and the 38.2 retracement is 109.98. So a retest to 109.9 - 100.20 will be the ideal to reenter shorts. The large bearish candle breaking out of the consolidation is a strong case to remain bearish.


On the daily, we can see a hanging man and reversal confirmation. So will look at early next week for shorts to be put on on any rally.


The AUDJPY, shows a trendline retest and a 78.6 retracement of the most recent fall in the audjpy. With a long legged doji at the top, spinning top formation. Next week, any rally is a good place to short.


GBPJPY retested the last major drop and is in a consolidation region on the weekly.
A retest of 158.30 is a really good place to enter short.

 
EURJPY on support.
 
JPY looks strong.


Sunday, April 10, 2016

A look at the JPY

The ~JPY has been in focus for the past week, with the very weak USDJPY dumping down after a long consolidation period.

The weekly USDJPY has closed on a very weak note.


The USDJPY has closed down for the week forming a big red bar. Usually this is followed by many bigger red bars. A tight channel shows that channel support may well be at 103.60 but that is too early to tell. The initial target is 106 - 105.50 from the head and shoulders pattern from the recent highs on 2015-06-04 to 2016-01-20.
However, take note that the USDJPY has now reached the end of the Bollinger band on the weekly. Which denotes oversold conditions.


On the daily USDJPY, we also see that it has reached the end of the Bollinger band.
On the daily, we also see a bearish graveyard doji. Usually, a hammer is preferred for a turn, so next week may gun for lower before higher. I don't know.

Looking at other JPY pairs, we see some similarities of price for the JPY being on support.

NZDJPY


NZDJPY is on a region of support. Price has bounced from there multiple times.
So caution is important.

AUDJPY


The AUDJPY is in a longer term channel from 2014-11-21 and has hit the 61.8% retracement of the recent low to high. Price has also moved out of the Bollinger band on the daily. Forming an inverted hammer.

CADJPY


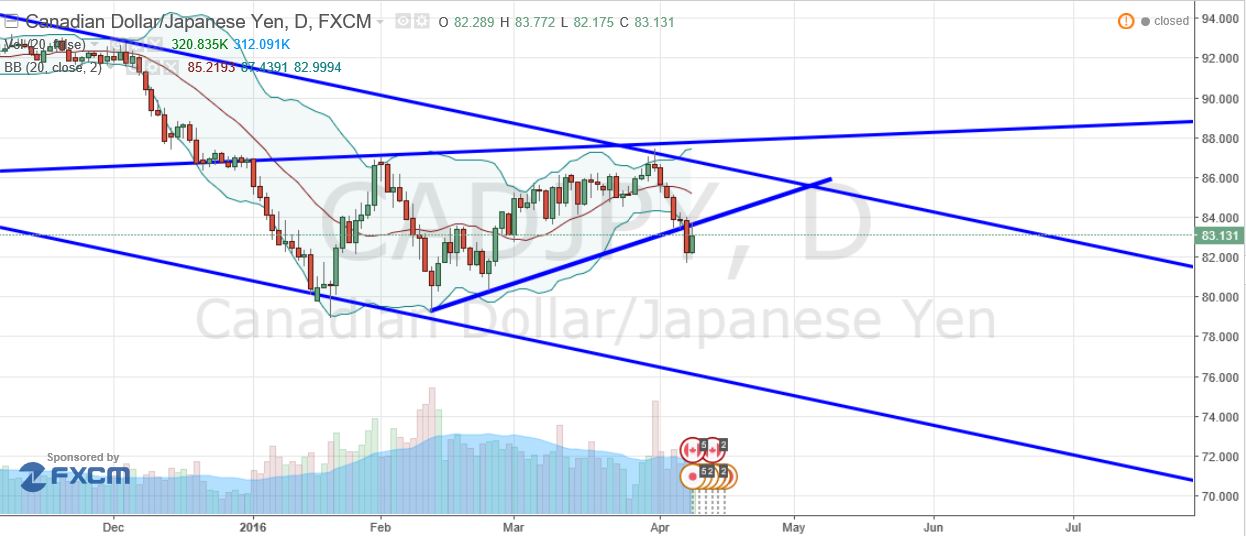
CADJPY also in a longer term down channel and has turned from both testing the underside of a trendline from 2011-10-03 to 2012-05-28 and also a channel resistance from 2015-06-15.
Price has moved to test the treadline of the most recent low to high and could trend lower.

GBPJPY


The GBPJPY also in a down channel and tested previous support on friday. Note that price is outside of the daily Bollinger band and an inverted hammer is formed.

EURJPY


EURJPY in a down channel and testing weekly resistance turned support on 2014-04-11, so caution may be taken here.


On the daily an inverted hammer has formed. Price is outside of the daily Bollinger band.

The XXXJPY pairs look very bearish, and I think we are near some sort of support. So I will look to short on a bounce somewhere.


Thursday, April 7, 2016

USDJPY

USDJPY on the daily has broken down. The strength of the jpy when the stockmarket is going up makes one feel worried and the market conditions.


The USDJPY has hit the 161% extension and still looks very weak.

It looks ready for a bounce and I may short on a rally towards 110.

Disclamer: I am not short any XXXJPY pairs, will look to short on a bounce.

Tuesday, April 5, 2016

NZDUSD,and USDJPY

Looking at NZDUSD, we are in a channel within a channel and has just reached short term support at 6768.


it is also the 1.618 extension from the high to the recent low at 1 Apr.

A rebound to 6830 will be a good place to reenter shorts.

A larger channel, is also seen on the daily.

channel support at 6838.


Disclaimer: I am not short the NZDUSD but may re-initiate shorts.

Looking at USDJPY, it is at channel support.


Since both NZDUSD znd USDJPY are at their support, NZDJPY will also be on its support.
So it will be a good time to take some profits and look to reshort higher, or on a break lower.
 
Disclaimer: I am short USDJPY

Saturday, April 2, 2016

A look at gold

A look at gold.

Gold usually moves opposite of the USD and a drop in gold should correspond to a strengthening USD.

This is gold chart.


The gold chart is showing at gold has broken out of a channel since 2014 and has retested the upper channel trendline at $1204. it may go down slightly more to $1190 where there is support and bounce. Currently there is a small pennant that is visible.

Will Gold go up?

I don't really know. However, if gold strengthens then we can think that the USD will decline.

Which makes it a really interesting thing to note that USDJPY chart.

 
We can see that the USDJPY is forming a pennant that is flagging down wards to $105.

Next week is earnings season, I think there will be great potential for something to move out of their consolidation.