Monday, July 25, 2016

usdjpy


USDJPY has dropped from the dailt trendline resistance and is heading towards the 38.2% retracement of the most recent upmove. 103.7 is the support and 50% retracement as well as a completion of the head and shoulders. resistance is back at 105.40-60. Interim support of a possible channel (smaller) is right here @ 104.40.


Sunday, July 17, 2016

A look at STI and SPX and the banks

The SPX broke into new highs again, will this be a false breakout? How will that affect the STI?


STI looks set to break up and head to 2973 - 2994.


DBS looks like its forming a wedge. Price consolidation is too long to be a pennant/ flag. I think next week STI will show its form.


OCBC looks like a inverted head and shoulders forming, with the neckline at 9.40. a break of the neckline will target 10.30.


Another look at a different angle, OCBC could be in a channel targeting 7.0 - 6.80.


UOB looks ready to break out.


Disclaimer: I am not long any of the bank stocks. It will be interesting to see what happens next week.

Tuesday, June 28, 2016

DXY

DXY is still in a range 96.60 - 95.60.


Price is at the support now, though I still like it at the neckline of the double bottom for a long.

If price breaks resistance, I expect a test of 97.00 then 99.00 on a flag extension.

Take note that it is near the end of the month of June.

I have no positions currently.

Monday, June 27, 2016

eurusd and dxy

A look at the eurusd and DXY.

 
The DXY looks like the usdchf, support is at 95.90 and resistance at 97.70 - 98.00, which coincide with fib extension to 1.618.


The eurusd is in a longer term channel. support 1.0915, resistance 1.110 to 1.1170. looks like a sell on rallies.

I am keeping away from the gbp, as it is very volatile.

Saturday, June 25, 2016

sgdmyr

SGDMYR, with the brexit and the turmoil all over, we can see the sgdmyr going to much higher places if 3.1 is broken. there is a long standing channel from 1991 on the monthly that could form a top at the completion of the flag.

Fibonacci retracement shows a 38.2% retrace, which is very shallow.


On the 4 hr , any price towards 3.014- 3.000 is good to buy. Could get the price on the early start of the week.


I have no position in the sgdmyr and may establish some next week. targets 3.1 - 3.3.
 

eurgbp

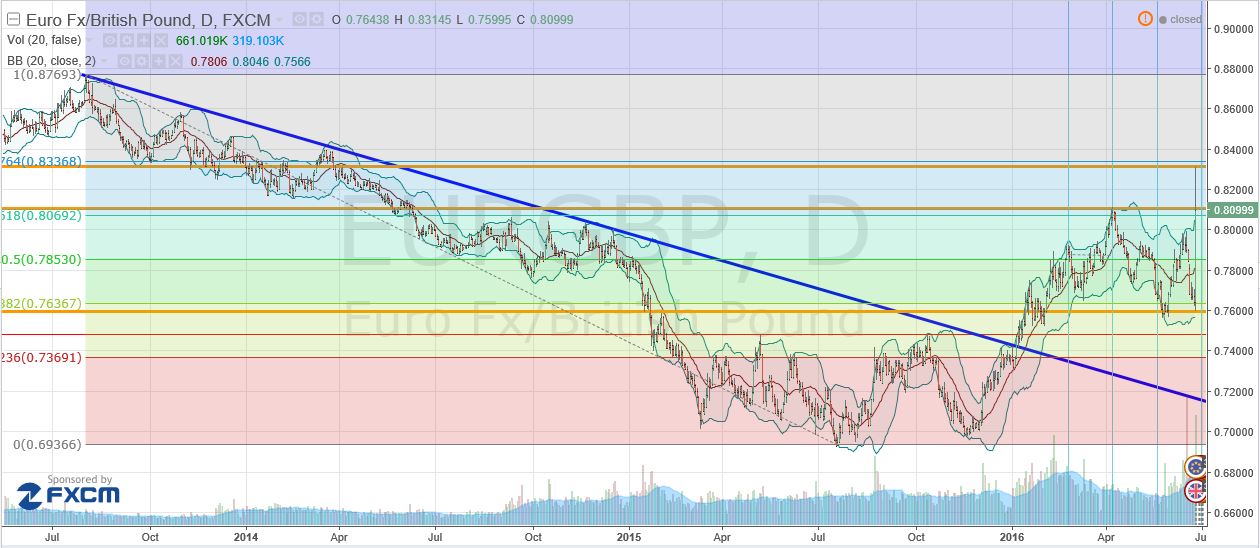
With the EU referendum and leave vote from Brexit, GBP crashed the floor. So this week, I took leave from the markets and stayed away from this high risk event.

From the daily chart,
We can see why the EURGBP price moved from one point to another.
The close is at the resistance, so there is potential for the move within this range. Though I will look at other pairs to trade instead and observe for awhile more.


In many pairs there are many long wicks, so will have to observe price action next week to determine if there is momentum in the movement or its one off.

eurgbp

With the EU referendum and leave vote from Brexit, GBP crashed the floor. So this week, I took leave from the markets and stayed away from this high risk event.

From the daily chart,
We can see why the EURGBP price moved from one point to another.
The close is at the resistance, so there is potential for the move within this range. Though I will look at other pairs to trade instead and observe for awhile more.


In many pairs there are many long wicks, so will have to observe price action next week to determine if there is momentum in the movement or its one off.