Monday, November 25, 2013

131125 usdcad


USDCAD going for a retracement to 1.0500? for a trendline retest?

Friday, November 22, 2013

131122 usdsgd


USDSGD 1H three drive formation? targets the broken trend line possible at 50%. 61.8 and 72.4% retracement. Red horizontal line is the 61.8 retracement.

Tuesday, November 19, 2013

131119usdsgd


USDSGD H1 showing a hammer formation, near the support. Bounce off 200KAMA, is encouraging for bulls.

looking for price confirmation and move into the wick to go long.

Thursday, November 14, 2013

131115 USDSGD


USDSGD on the 15min chart need to bounce here or test and bounce against 1.2474 to continue to upside.


USDSGD in the H1, bounced at trendline retest + 61.8 retracement of Wednesday upmove. above 1.2490, head look to top of channel.

USDSGD 131114


USDSGD looking to go long on retest of trendline 38.2 retracement @ 1.2475 for possible inverted head and shoulders formation.

Wednesday, November 13, 2013

EURJPY USDJPY 131114

A look at the jpy pairs

EURJPY

eurjpy on the daily very extended as we all know, jpy pairs have been skyrocketing.


On the daily, we can see a possible break and retest of the broken trendline at 134.50. To form a possible head and shoulders top. Risk above the highs.

USDJPY

Could be forming a double top. Pullback has been minimal, so be cautious.

AUDUSD 131114

AUDUSD currently forming an inverted hammer on the H4, could be a retest of trendline break turned support to go the channel resistance + weekly pivot + 38.2 retracement + previous support @ 0.9420.

USDSGD 131114


USDSGD has been in a small ascending channel for the past 3 weeks. Bounce off the Long term ascending trendline on the weekly. recent pull back + bottom of channel comes in at 1.2450. Small hammer forming on the 4hr, with bounce at channel support. Small long here against the 38.2 retracement.

EURGBP 131114


Daily  EURGBP reversed at trendline channel support and formed a bearish dark cloud cover on the daily at rejecting price at 50% retracement.


On the H4, we see a 38.2 retracement form the most recent down move. A possible flag formation targets channel support again. Short here 20 pip stop.

131114 AUDCAD

 
On the 11/11/13, I thought that AUDCAD is near support + 38.2 retracement.


AUDCAD bounced off the 38.2, now challenging overhead resistance. If broken the next will be channel resistance at 0.9870. 0.9830 is the horizontal resistance of previous support. See blue box.

Also lines up with a 50% and 61.8 retracement.

UOL 131113

 Nikkei

 UOL


USDJPY

Looking awfully familiar. Could display similar type of movement.

HAW PAR 131113

 
Haw par, never say die!


Add some lines and I see something else.


Currently price retest the Trendline break at 78.6 retracement. Sticking to the trendline like glue.

 
Failure targets 15 - 20% drop. Something happening soon?

Monday, November 11, 2013

AUDCAD 131112


AUDCAD H4 nearing 61.8 and major trendline support. Shorts be cautious. If reversal there could mean USDCAD starts to strengthen while AUDUSD will rebound from current weakness short term.

USDSGD 131111 update


USDSGD H1 showing bearish wicks, in a consolidation pattern at channel resistance. price has retested the ascending trendline and could correct to 1.2472 - 1.2460.

Sunday, November 10, 2013

AUDCAD 131111

AUDCAD daily nearing trendline support, below that targets 200KAMA.

Soon to be I wanna be sick both ways level.

If break lower, go short.
If hold, go long.
If this pair breaks down, AUD will be flaming like a meteor compared to CAD.

USDSGD 131111

As much as I want to be bullish on this pair, I will look to go long on dips.


Weekly looks like there is still scope for more upside at least to 1.2535. (38.2 retracement of large down move)
Price just turn in from oversold.

 
On the daily, price has been moving in a channel, we are now, butting against resistance. Overbought.
 

On H4, shallow retrace with resistance above. Look to long at dips to
1.2460. Overbought.

EURUSD 131110

 
EURUSD daily currently supported by 200KAMA and 50% retracement. Daily and weekly oversold. EURUSD has closed below the support and looks bearish.

 
On H4, we see that EURUSD has been following a channel. Channel support is currently holding. Will like to short on a rebound to 1.3415. (23.6 retracement from high to current low). H4 oversold.
Perhaps early next week.

Great Eastern 131110


Great Eastern in a channel, 61.8 retracement from the highs is current resistance. Below 17.6 look for more downside

Genting SP 131110


Genting SP broke out to the upside and formed an ascending triangle, targets 50% retracement at $1.42 which is also former resistance now support. Hammer formation looks like price is looking to turn soon.

Friday, November 8, 2013

USDCAD 131108

 
USDCAD daily resistance overhead and pull backs have been minimal.


USDCAD weekly, is in an ascending channel  there is room for more upside till 1.0884

Friday, November 1, 2013

usdsgd 131102

Finally, after waiting and waiting for weeks, USDSGD looks to be turning to the upside a look at the charts.
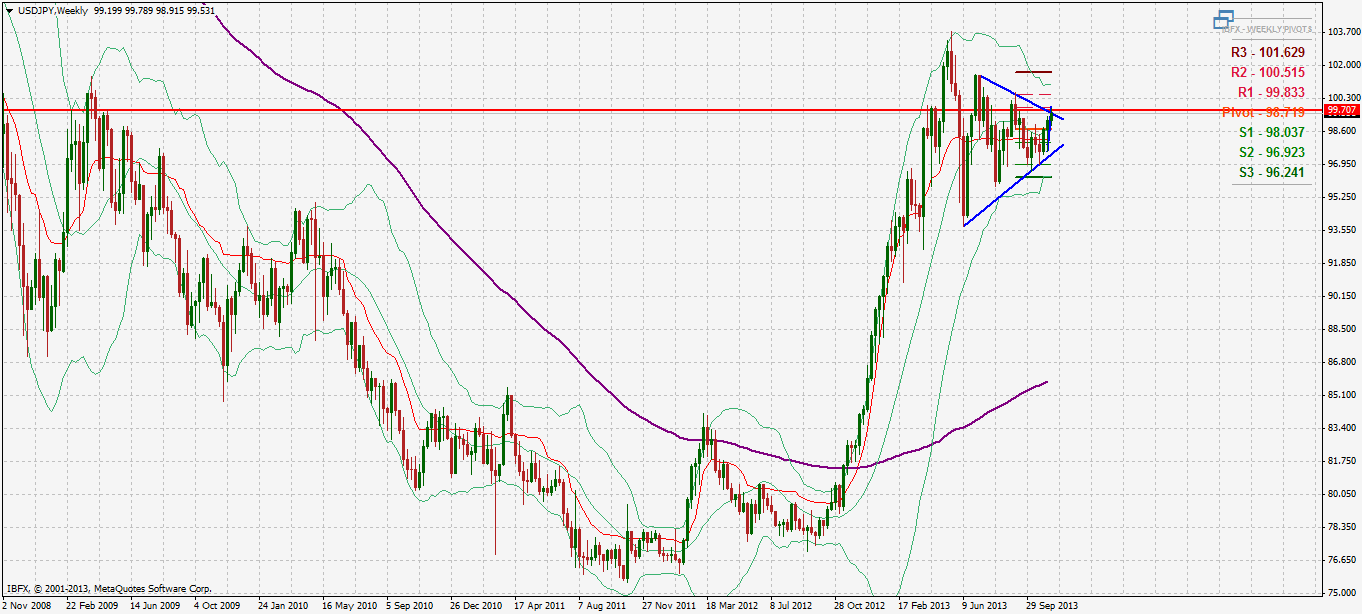
USDSGD WEEKLY

a false break of the long term trendline and an inverted hammer + engulfing pattern on the weekly.
We have also just turned from oversold on the weekly.

USDSGD DAILY

Looking at the daily, because that will give us a clearer picture on things.


Candle 1: Shows a high wave candle that is signalling a possible change in trend.
Candle 2: Bearish hammer, price rejecting with long wick
Candle 3: This candle has a wick that is rejecting price at a trendline retest.
Candle 4 & 5: This candle is presently the resistance that must be taken off for bullish momentum to develop
Candle 5: An engulfing pattern which can mean lower price but at the end of a down trend a possible exhaustion signal. Price top of this formation also resistance that needs to be overcome.

As we can see, price is still in the small ascending channel. Again if price falls below the low of candle 1, we can say that USDSGD will continue to slump as it will become a bearish flag pattern.


Placing two Fibonacci retracements, we can see that 23.8 and 50 retracement of the high to the lows from two points coincide with 1.2465, where there is some price congestion.. Price is still bearish below 1.2465.
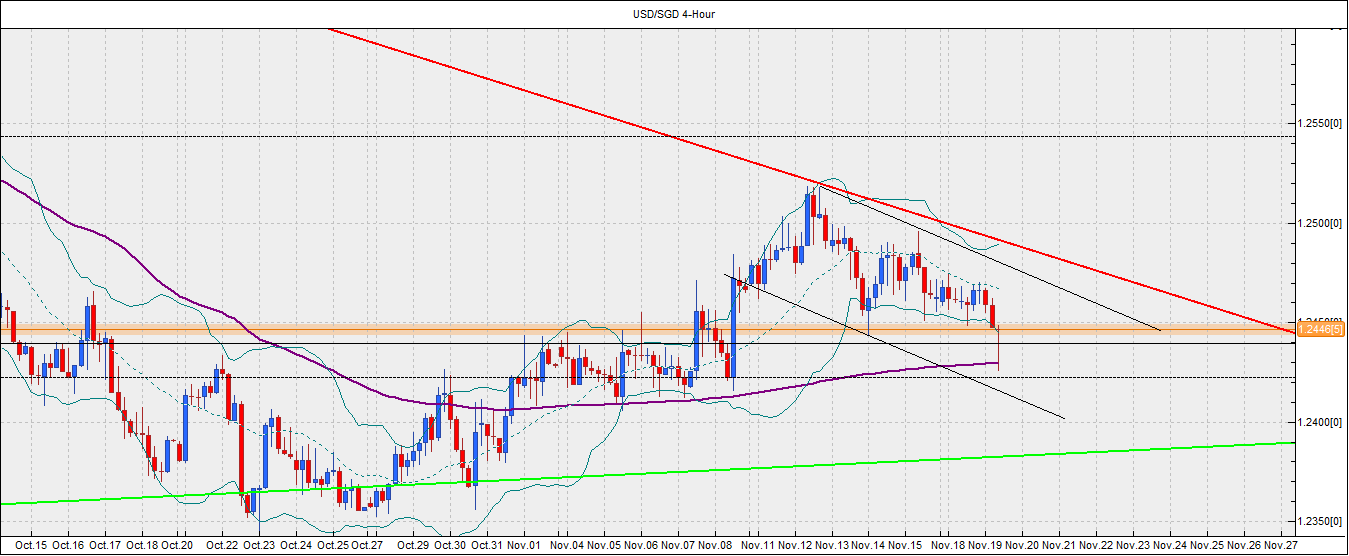
USDSGD 4H


H4 is at the top of the range and above horizontal resistance. Dips to 1.2420 - 1.2410 is the 23.8 and 38.2 retracement and can be bought for a move above 1.2465.
Stops below 1.2380.
H4 200 KAMA also supporting price at 1.2410.

USDSGD 1H


On the H1, price is in a secondary channel, 1.2415 is the support.
Price could target 1.2530 from here.

I am pending long on the USDSGD.