Wednesday, October 30, 2013

usdsgd 131030


USDSGD daily rejected price at resistance 1.2425. and is starting to form a bearish engulfing. Price look towards 1.2275 if support at recent low 1.2343 breaks.


Q&M Dental 131030

Q&M in a descending channel, price is currently supported at 0.30. Above 0.325 is bullish.

IHH 131030


IHH looking like a huge triangle waiting for a possible breakout. Price is consolidating within the range of 1.64 - 1.53. Very low volume.

USDJPY 131030


USDJPY daily very near the 61.8 retracement and trendline resistance.


On the H4, we see that price and above the 200 KAMA. and currently supported.
I think that USDJPY may be trying to form this pattern to 99.75 before a move down for an extension of the triangle.

GBPUSD 131030

ADP, CPI, FOMC day today.

GBPUSD  on the H4 is looking that it might run up higher to retest the 32.8 - 61.8 level. Highs from 1.6250 is looking to be setting up for a possible double top. 200 KAMA on the H4 is coming near 38.2 retracement.
End of month + FOMC makes it tough trading conditions. I will wait for the levels and candlesticks reversals before trading.

I am also not feeling well these few weeks, best to stay out till feeling more adequate

Wednesday, October 23, 2013

capitaland 131024

Capitaland still in a channel

Low risk short here with stop above most recent highs. target channel bottom

AUDUSD NZDUSD AUDNZD 131024

AUDNZD


AUDNZD has broken to the upside from nzdusd weakness. Now is above the daily trendline.

On the H4 , we see that AUDNZD has moved to retest the trendline at 1.1430 and above the support.
Looking bullish to 1.16.

AUDUSD


 AUDUSD bouncing off the trendline support and towards the 50% retracement at 0.9680.


NZDUSD


NZDUSD on the daily has a bearish engulfing pattern from yesterday. Still above the trendline support.


On the H4 has bounced off the support and currently capped by horizontal resistance + 38.2 retracement.

NZDUSD looking weaker than AUDUSD, AUDNZD looks like it will run higher from the double bottom. 

USDJPY 131024


USDJPY on the weekly has extended the triangle and at the apex. Breakout potential very high.


USDJPY on the H4 looks to be in a small down channel. Currently at support and bouncing, possible bounce to 50% retracement of recent down move + 61.8% most recent down move places resistance at 97.90 - 98.00.


On the H1, we see that 98.00 is the breakdown point of price.

Short small at 98.00, with SL above the channel resistance.

AUDCAD 131024

I got out of my previous AUDCAD short at break even yesterday. Will look to short again higher.


AUDCAD on the daily form a hammer yesterday, with long wick rejecting price at 0.9905 support of channel. Looks like it might go higher to retest the longer term trendline support + 61.8 retracement.


AUDCAD on the H4 form a bullish engulfing pattern which may support price at 0.9905.

Will look higher at 1.0120 and wait for reversal candle before shorting.

EURGBP 131023


EURGBP blasting to retest trendline at 50% retracement? 200KAMA currently capping.

XAUUSD 131023


XAUUSD daily, trying to close to resistance and above 200KAMA + channel resistance. Above 1349, aim for 1432.
Otherwise, a possible head and shoulders forming.

AUDCAD 131023


AUDCAD reversed on the daily, currently at channel support.


A longer term view,  AUDCAD has retested the horizontal trendline and formed an inverted hammer on the break.


On the H4, AUDCAD currently at horizontal breakout point, a close below this point will become a failed break out and a possible short to bottom of the range.


AUDCAD on the weekly, forming an inverted hammer and overbought. (candle unclosed)

USDSGD update 131023


USDSGD took my SL with 11 pips and reversed.

On the daily, a possible fake out of the channel with a slightly lower low. Look for close of candle on the daily to decide to be long or short.

Close near lows, bearish. Close over the previous day, bullish.

Tuesday, October 22, 2013

usdsgd 131022

NFP today.


USDSGD in a long term ascending channel, support is 1.2370, resistance 1.2450.
USDSGD bounced off the trendline support nicely, just recover from oversold conditions. On the daily, downsloping trendline still capping price. Apart from the doji formed on the 18/10, price has formed also a bullish engulfing pattern on the 20/10 and 21/10.


USDSGD looking like it might be trying to form a pattern, targeting 1.2765, 61.8 retracement of recent down move or 1.2950.


H4 we see that 9KAMA is supporting price now and price has come to retest broken trendline. Long here with stops below the most recent low. Targeting 1.2765 at least.


On the weekly, USDSGD in a channel. Midline will be 1.2765, top of channel 1.2950.

Long small size here, look to add on break of 1.2450.
1st objective R:R = 1: 6.5.
2nd objective R:R = 1:9.9.

Sunday, October 20, 2013

AUDCAD AUDNZD AUDUSD USDCAD NZDUSD 131019

AUDNZD


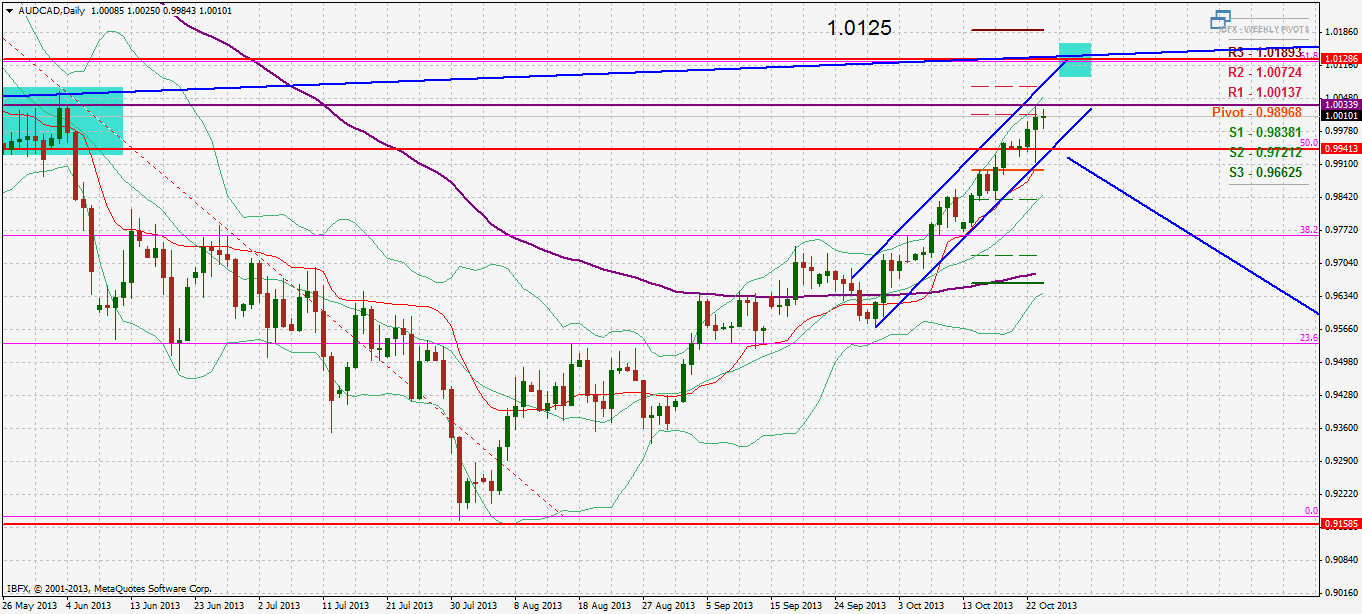
AUDCAD on the daily close to oversold.
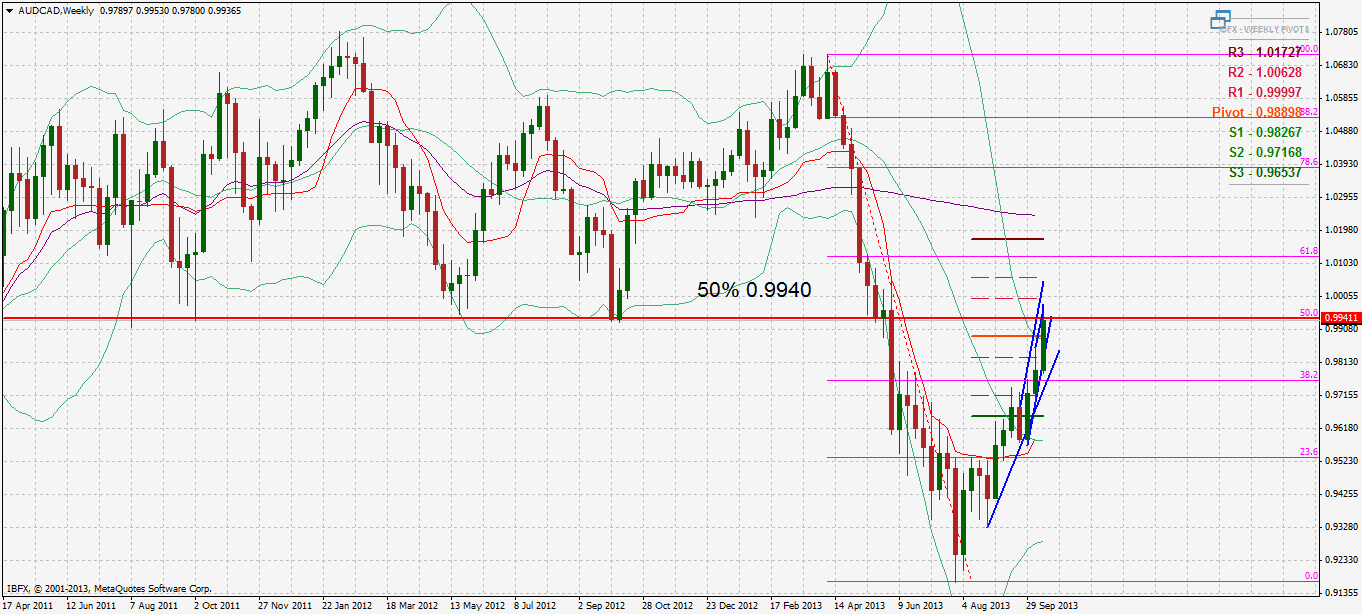
On the weekly, oversold.
AUDCAD on the weekly has come up to retest the previous support and 50% retracement of previous down move. On the  daily, top of up trend channel with a very steep ascend. 


On the H4, AUDCAD starting to form a type of ascending channel and oversold.


I am short AUDCAD here small size.

 AUDNZD


AUDNZD on the daily still capped below the 200KAMA which is flattening and still below the daily trendline. 


On the H4, AUDNZD is forming higher lows with a flat top, a bullish triangle pattern?

AUDUSD


On 9 August, I noted this formation on the chart. Too bad i didn't take the trade, as it was pretty unbelievable.


Well, believe it, AUDUSD has reached the level that was noted 9 August. With strong bullish close into the 50% retracement.
Daily and weekly is overbought, but no reversal candle spotted yet.


H4 candles are flat lining against the resistance, should look for reversal candle formation before shorting. Next level is near parity at 0.9920, which the 200 KAMA is running through + broken trendline retest of triangle break.

I got burnt a huge hole in my ass shorting this pair before at 0.9420.

USDCAD


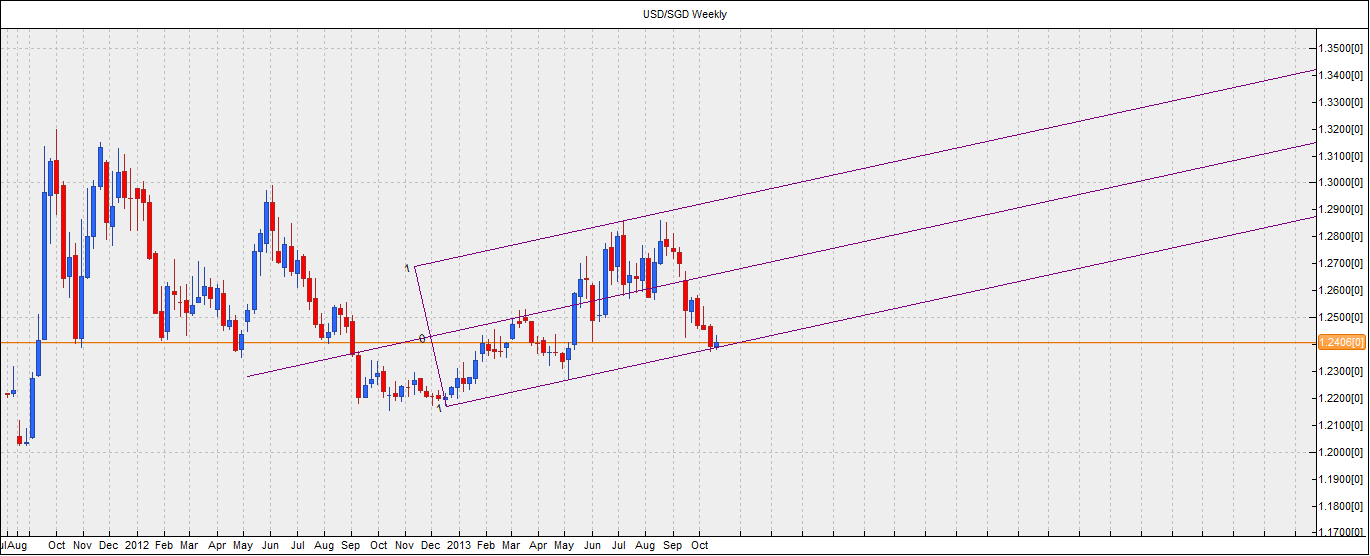
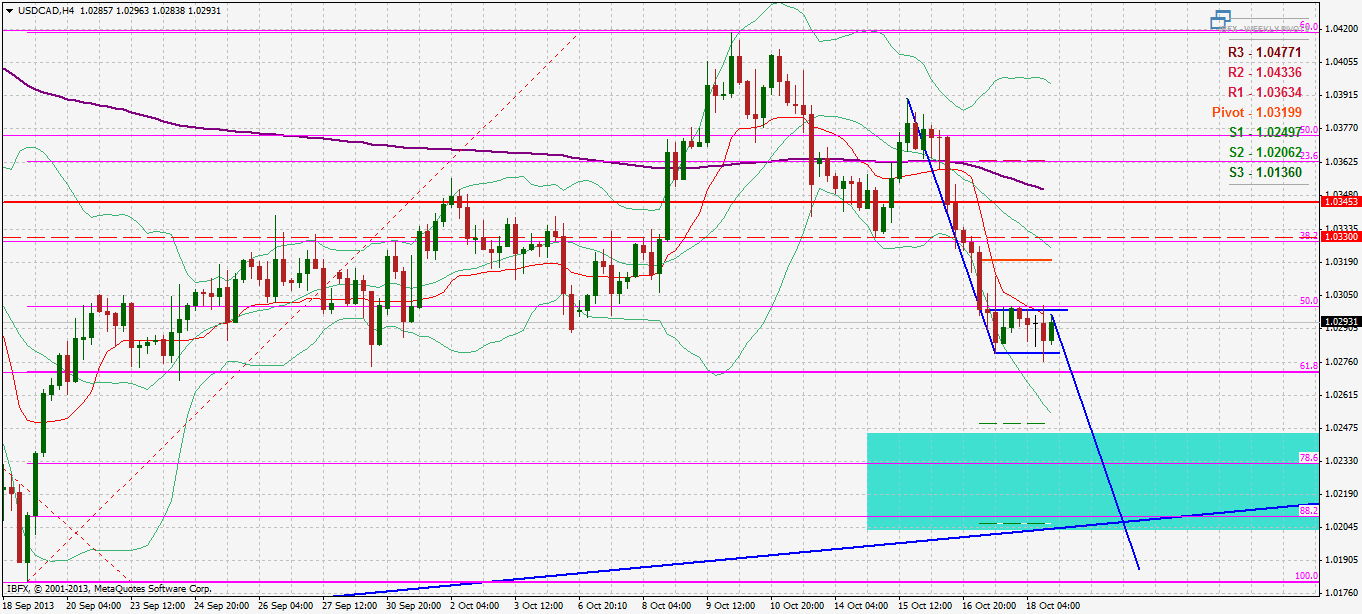
USDCAD H4, currently supported at 61.8 retracement of recent upmove, also the 23.8 retracement of longer downmove previously.
Flag extension leads to lows of 1.0180 + 200KAMA at weekly chart + 50% retracement of weekly upmove.
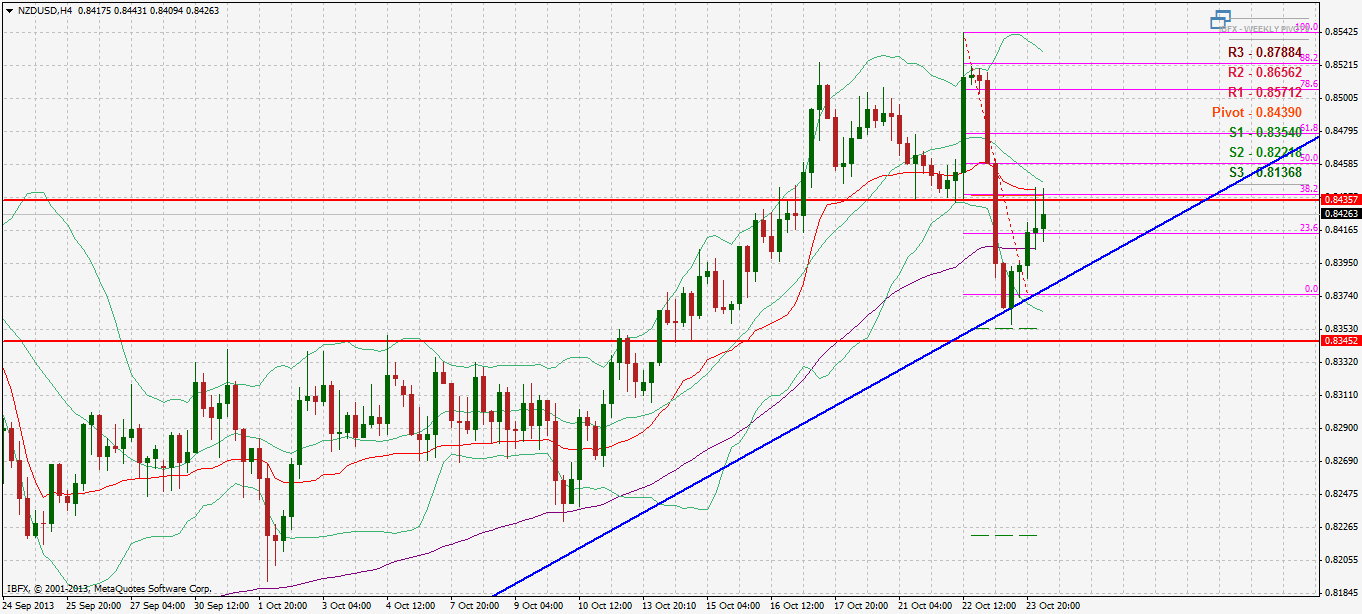


NZDUSD


NZDUSD daily has overhead resistance at 0.8580 - 0.8620. Looks like it might extend to 123.8 fib. and long term resistance on the weekly trendline + weekly R1 0.8570 + trendline retest at 0.8670. Look for reversal candles on the H4.


No reversal candles yet on the H4.
NZDUSD daily is oversold + weekly is oversold.

In my humble opinion, I think NZD and CAD will outperform AUD in the short term against the dollar. And the weakness of the AUDNZD compared to the AUDCAD could mean a lower low on the AUDNZD before the final push up.

Sunday, October 13, 2013

RMB as a reserve currency?

In the past few months, we have seen China aggressively pursue currency swaps with many countries. The most recent being the deal with ECB to swap 350 billion yuan and €45 billion.

Read 

Europe and China have agreed a currency swap deal to boost trade and investment between the regions.


Also, in recent years, China have also increase its consumption with the rise of the super rich in its populations. China have trade ties with many countries and payments in yuan have become more accepted. 

Read
The Chinese yuan was the ninth most traded currency in the world in the most recent ranking by the Bank for International Settlements, the first time the currency has broken into the top 10.


So my interest is if China is going to become a global reserve currency soon (when) and how that will affect the pricing of its currency pairs.

Read
China's Renminbi Is Well On Its Way To Becoming A Global Reserve Currency
Q&A: What’s a Currency Swap Line?


China has also taken steps to increase the ease of globalisation of its currency by setting up a Shanghai free trade zone which could move the country up the ranks of financial centers of the World without relying on Hong Kong.

Read
China launches free trade zone in Shanghai


On the Asian pacific region, we can no longer deny that China is already a "Big brother" in status. With many countries relying on China for growth.

The diagrams below show some trade information from http://www.intracen.org on China's trade statistics.


If China is not exporting its products, where does it go? To its own market maybe. High consumption 


As you can see lots of markets in the bottom left corner, exporting to China. With only the United States and Hong Kong importing more.

Also, in Asia Briefing we have an interesting article on the change in roles of China and Asean.

Read

So what is the outlook of the RMB in the months to come? A look at the charts.

SGDCNY

As you can see, SGDCNY is moving in a descending channel and is currently trapped between the 21 SMA and the 200 SMA. the 21SMA and the 34 SMA has just recently crossed each other signalling a short term bullish move. Also in the smaller channel, we have channel and horizontal resistance right here at 4.90. 

Above 4.90, 5.00 is the longer term resistance. 

Ideally to get long the RMB between 4.90 and 5.00. However, if smaller time frame channel is respected, expect the RMB to strengthen further against the SGD.

EURCNY


Looks boxed between 8.50 to 8.00

CNY could be weakening short term. Wait for 8.50 before getting long RMB.


Thursday, October 10, 2013

AUDNZD AUDUSD NZDUSD USDCAD XAUUSD 131010

AUDNZD


AUDNZD daily butting up against key trendline resistance. Overhead resistance comes from weekly R1 1.1435 and 200KAMA at 1.1465.
Above these 1.16 will come quickly.

AUDUSD


AUDUSD daily has been forming very small bodies with long wicks indicating indecision. Longer bullish wicks show that there is still a bullish bias in the market.
Failure here will form a double top. or even a channel of 0.9505 - 0.9280.


On the weekly chart, we have a star formation against resistance. Which could signal a change in trend.


On H4, AUDUSD have broken an ascending wedge and looking to retest 0.9455 broken trendline support.

NZDUSD


NZDUSD daily has finally broken down, after stopping me out at b/e. Argh.
Price is confined within the triangle and respecting the channel.


On the H4, NZDUSD bounced against the 200KAMA. Price is looking confined, so a low risk short can be placed against horizontal resistance at 0.8270 - 0.8260.
Next resistance is trendline resistance at 0.8317.

USDCAD


USDCAD weekly, has broken above resistance of 1.0345. Capped by weekly R3 1.0420. support is at 1.0345. Price is nicely tracking within an ascending channel.


On the weekly, long bullish wicks show rejection of price and aims higher.

XAUUSD


XAUUSD daily, still supported by neckline.