AUDNZD
AUDNZD daily butting up against key trendline resistance. Overhead resistance comes from weekly R1 1.1435 and 200KAMA at 1.1465.
Above these 1.16 will come quickly.
AUDUSD
AUDUSD daily has been forming very small bodies with long wicks indicating indecision. Longer bullish wicks show that there is still a bullish bias in the market.
Failure here will form a double top. or even a channel of 0.9505 - 0.9280.
On the weekly chart, we have a star formation against resistance. Which could signal a change in trend.
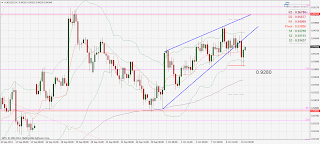
On H4, AUDUSD have broken an ascending wedge and looking to retest 0.9455 broken trendline support.
NZDUSD
NZDUSD daily has finally broken down, after stopping me out at b/e. Argh.
Price is confined within the triangle and respecting the channel.
On the H4, NZDUSD bounced against the 200KAMA. Price is looking confined, so a low risk short can be placed against horizontal resistance at 0.8270 - 0.8260.
Next resistance is trendline resistance at 0.8317.
USDCAD
USDCAD weekly, has broken above resistance of 1.0345. Capped by weekly R3 1.0420. support is at 1.0345. Price is nicely tracking within an ascending channel.
On the weekly, long bullish wicks show rejection of price and aims higher.
XAUUSD
XAUUSD daily, still supported by neckline.


No comments:
Post a Comment